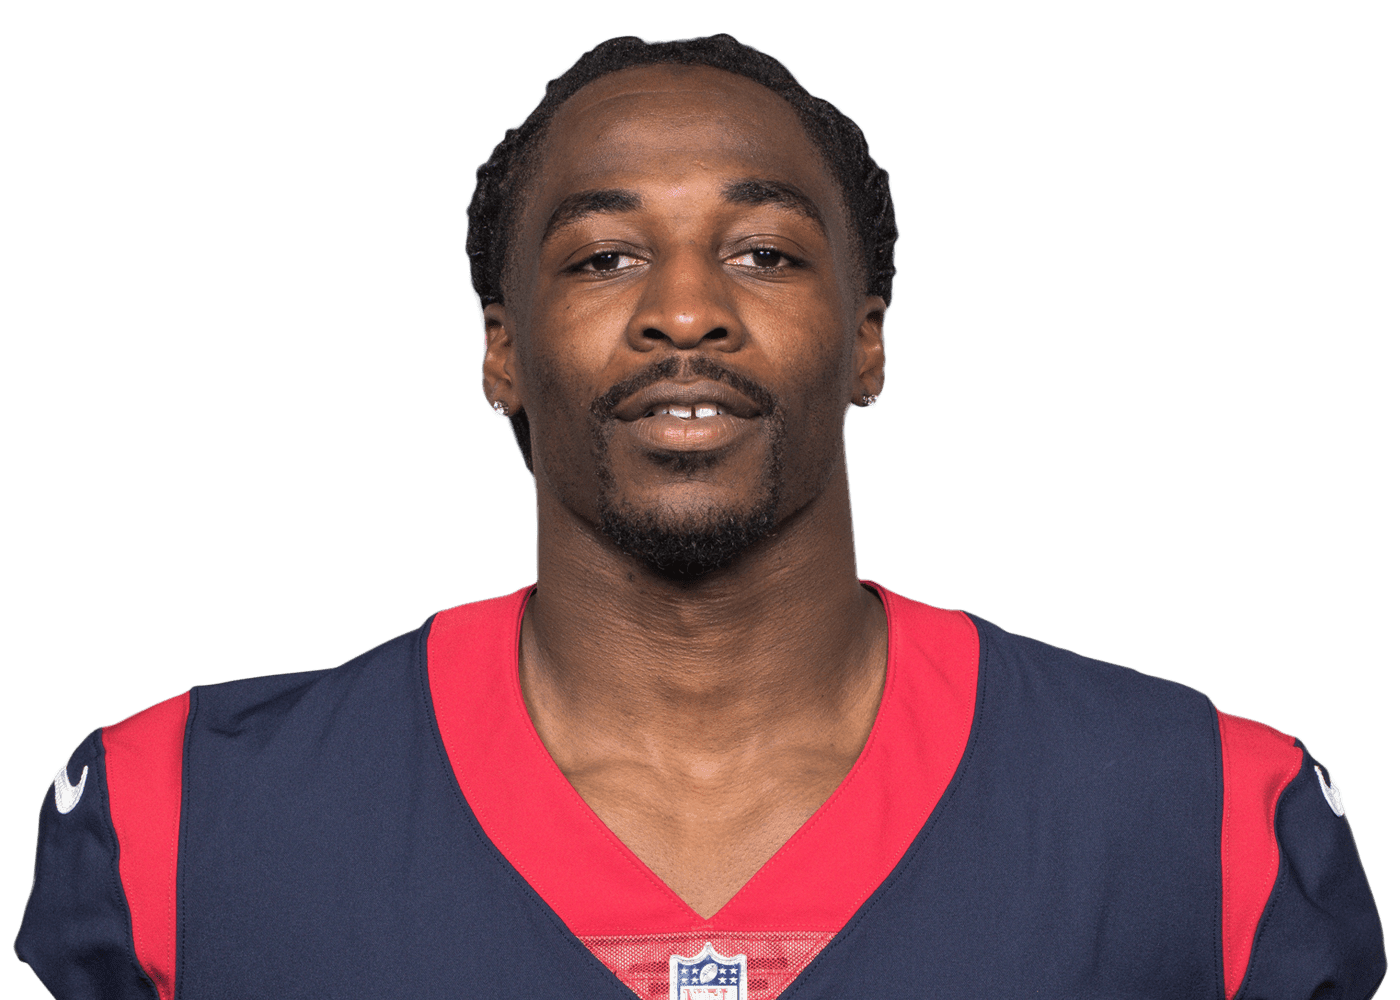
Bruce Ellington
WR · DET · 2017–2018 · 18 games · South Carolina · 69 in / 200 lb · Draft: 2014 R4 #106 (SF)
Season by season (regular season)
| Season | Team | G | Tgt | Rec | Rec Yds | Rec TD | Air Yds | YAC | Tgt Sh | Rec EPA | Car | Rush Yds | PPR |
|---|---|---|---|---|---|---|---|---|---|---|---|---|---|
| 2017 | HOU | 11 | 57 | 29 | 330 | 2 | 562 | 136 | 15% | -0.5 | 3 | 17 | 75.7 |
| 2018 | HOU/DET | 7 | 42 | 31 | 224 | 1 | 204 | 108 | 18% | 0.9 | 1 | 2 | 59.6 |
| Career | 18 | 99 | 60 | 554 | 3 | 766 | 244 | – | 0.4 | 4 | 19 | 135.3 |
Splits (per game)
| Split | G | Team SU | Team ATS | Tgt | Rec | Rec Yds | Rec TD | Air Yds | YAC |
|---|---|---|---|---|---|---|---|---|---|
| All games | 18 | 5-13 | 8-10 | 5.5 | 3.3 | 30.8 | 0.2 | 42.6 | 13.6 |
| Home | 10 | 4-6 | 4-6 | 5.4 | 3.6 | 30.6 | 0.0 | 33.2 | 14.7 |
| Away | 8 | 1-7 | 4-4 | 5.6 | 3.0 | 31.0 | 0.4 | 54.2 | 12.1 |
| Team won | 5 | 5-0 | 5-0 | 5.4 | 4.2 | 39.6 | 0.0 | 32.2 | 16.0 |
| Team lost | 13 | 0-13 | 3-10 | 5.5 | 3.0 | 27.4 | 0.2 | 46.5 | 12.6 |
| Team favored | 7 | 3-4 | 3-4 | 4.0 | 2.7 | 25.6 | 0.0 | 29.0 | 9.6 |
| Team underdog | 11 | 2-9 | 5-6 | 6.5 | 3.7 | 34.1 | 0.3 | 51.2 | 16.1 |
| Last 5 games | 5 | 2-3 | 2-3 | 6.2 | 4.8 | 28.4 | 0.0 | 19.8 | 16.8 |
| Last 10 games | 10 | 3-7 | 4-6 | 5.9 | 4.1 | 32.3 | 0.1 | 28.9 | 16.6 |
Vs every opponent (per game)
| Opp | G | SU | ATS | Tgt | Rec | Rec Yds | Rec TD | Air Yds | YAC |
|---|---|---|---|---|---|---|---|---|---|
| TEN | 3 | 1-2 | 1-2 | 3.0 | 2.3 | 32.0 | 0.0 | 31.0 | 8.7 |
| ARI | 2 | 2-0 | 2-0 | 5.5 | 5.0 | 40.0 | 0.0 | 26.5 | 16.5 |
| LA | 2 | 0-2 | 0-2 | 9.5 | 5.5 | 38.0 | 0.5 | 57.0 | 30.0 |
| NE | 2 | 0-2 | 1-1 | 7.5 | 4.0 | 48.0 | 1.0 | 105.0 | 10.5 |
| BAL | 1 | 0-1 | 1-0 | 8.0 | 3.0 | 29.0 | 0.0 | 46.0 | 19.0 |
| CAR | 1 | 1-0 | 1-0 | 9.0 | 6.0 | 52.0 | 0.0 | 32.0 | 30.0 |
| CHI | 1 | 0-1 | 0-1 | 7.0 | 6.0 | 28.0 | 0.0 | 22.0 | 11.0 |
| CLE | 1 | 1-0 | 1-0 | 3.0 | 2.0 | 22.0 | 0.0 | 15.0 | 13.0 |
| IND | 1 | 0-1 | 0-1 | 8.0 | 3.0 | 22.0 | 0.0 | 85.0 | 10.0 |
| JAX | 1 | 0-1 | 0-1 | 2.0 | 0.0 | 0.0 | 0.0 | 6.0 | 0.0 |
| KC | 1 | 0-1 | 0-1 | 3.0 | 2.0 | 30.0 | 0.0 | 37.0 | 13.0 |
| NYG | 1 | 0-1 | 0-1 | 1.0 | 1.0 | 10.0 | 0.0 | 10.0 | 0.0 |
| SEA | 1 | 0-1 | 1-0 | 4.0 | 1.0 | 13.0 | 0.0 | 43.0 | 8.0 |
Defenders who have made plays on him
From play-by-play since 2016: sacks, interceptions, QB hits, pass breakups and solo tackles credited to one player against the other. Open full player-vs-player →
| Player | Games met | Sacks | INT | QB hits | Pass def | Solo tkl | Years |
|---|---|---|---|---|---|---|---|
| Jonathan Jones H2H | 2 | 0.0 | 0 | 0 | 2 | 2 | 2017–2018 |
| John Johnson H2H | 2 | 0.0 | 0 | 0 | 1 | 1 | 2017–2018 |
| Eric Rowe H2H | 1 | 0.0 | 0 | 0 | 1 | 1 | 2018–2018 |
| Shaquill Griffin H2H | 1 | 0.0 | 0 | 0 | 1 | 0 | 2017–2017 |
| Michael Brockers H2H | 1 | 0.0 | 0 | 0 | 1 | 0 | 2017–2017 |
| Rob Gronkowski H2H | 1 | 0.0 | 0 | 0 | 1 | 0 | 2017–2017 |
| Telvin Smith H2H | 1 | 0.0 | 0 | 0 | 1 | 0 | 2017–2017 |
| Pierre Desir H2H | 1 | 0.0 | 0 | 0 | 1 | 0 | 2017–2017 |
| Johnathan Cyprien H2H | 1 | 0.0 | 0 | 0 | 1 | 0 | 2017–2017 |
| Eric Reid H2H | 1 | 0.0 | 0 | 0 | 1 | 0 | 2018–2018 |
| Nickell Robey-Coleman H2H | 2 | 0.0 | 0 | 0 | 0 | 4 | 2017–2018 |
| Tony Jefferson H2H | 1 | 0.0 | 0 | 0 | 1 | 0 | 2017–2017 |
| Logan Ryan H2H | 2 | 0.0 | 0 | 0 | 0 | 3 | 2017–2018 |
| Prince Amukamara H2H | 1 | 0.0 | 0 | 0 | 0 | 3 | 2018–2018 |
| Luke Kuechly H2H | 1 | 0.0 | 0 | 0 | 0 | 2 | 2018–2018 |
| Nate Hairston H2H | 1 | 0.0 | 0 | 0 | 0 | 2 | 2017–2017 |
| Stephon Gilmore H2H | 1 | 0.0 | 0 | 0 | 0 | 2 | 2017–2017 |
| Kenny Vaccaro H2H | 1 | 0.0 | 0 | 0 | 0 | 2 | 2018–2018 |
| Haason Reddick H2H | 1 | 0.0 | 0 | 0 | 0 | 2 | 2018–2018 |
| Antoine Bethea H2H | 1 | 0.0 | 0 | 0 | 0 | 2 | 2018–2018 |
| Bryce Callahan H2H | 1 | 0.0 | 0 | 0 | 0 | 2 | 2018–2018 |
| Ja'Whaun Bentley H2H | 1 | 0.0 | 0 | 0 | 0 | 1 | 2018–2018 |
| Budda Baker H2H | 1 | 0.0 | 0 | 0 | 0 | 1 | 2017–2017 |
| Mark Barron H2H | 1 | 0.0 | 0 | 0 | 0 | 1 | 2018–2018 |
| Tyrann Mathieu H2H | 1 | 0.0 | 0 | 0 | 0 | 1 | 2017–2017 |
Lineups he wins with
Team record when both players played ≥50% of offensive snaps.
| Teammate | Team | G | W-L | ATS | PPG | Margin | Years |
|---|---|---|---|---|---|---|---|
| Lamar Miller RB | HOU | 12 | 3-9 | 6-6 | 25.6 | -1.3 | 2017–2018 |
| DeAndre Hopkins WR | HOU | 12 | 3-9 | 6-6 | 25.6 | -1.3 | 2017–2018 |
| Deshaun Watson QB | HOU | 8 | 2-6 | 4-4 | 29.9 | +1.6 | 2017–2018 |
| Ryan Griffin TE | HOU | 7 | 2-5 | 4-3 | 33.1 | +5.0 | 2017–2018 |
| Will Fuller WR | HOU | 6 | 2-4 | 3-3 | 32.2 | +6.5 | 2017–2018 |
QB ↔ receiver connections
| With | Tgt | Rec | Yds | TD | INT | EPA/tgt | Years |
|---|---|---|---|---|---|---|---|
| D.Watson | 35 | 20 | 260 | 2 | 1 | +0.43 | 2017–2018 |
| T.Savage | 35 | 17 | 162 | 1 | 1 | -0.25 | 2017–2017 |
| M.Stafford | 30 | 23 | 132 | 0 | 0 | -0.19 | 2018–2018 |
Injury history
| Season | Wk | Team | Game status | Injury | Practice |
|---|---|---|---|---|---|
| 2018.0 | 16.0 | DET | Out | Hamstring | Limited Participation in Practice |
| 2018.0 | 15.0 | DET | Out | Hamstring | Did Not Participate In Practice |
| 2018.0 | 14.0 | DET | Questionable | Back | Limited Participation in Practice |
| 2018.0 | 13.0 | DET | Questionable | Back | Limited Participation in Practice |
| 2018.0 | 12.0 | DET | Questionable | Back | Limited Participation in Practice |
| 2017.0 | 13.0 | HOU | – | Knee | Limited Participation in Practice |
| 2017.0 | 12.0 | HOU | – | Ribs | Full Participation in Practice |
| 2017.0 | 11.0 | HOU | – | Ribs | Full Participation in Practice |
| 2017.0 | 10.0 | HOU | – | Ribs | Full Participation in Practice |
| 2017.0 | 3.0 | HOU | – | Concussion | Full Participation in Practice |
| 2017.0 | 2.0 | HOU | Out | Concussion | Did Not Participate In Practice |
Game log
| Date | Szn | Wk | Opp | Score | SU | Line | ATS | O/U | Tgt | Rec | Rec Yds | Rec TD | Air Yds | YAC | Tgt Sh | Rec EPA | Car | Rush Yds | PPR |
|---|---|---|---|---|---|---|---|---|---|---|---|---|---|---|---|---|---|---|---|
| 2018-12-09 | 2018 | 14 | @ARI | 17-3 | W | -2.5 | W | U | 4 | 4 | 17 | 0 | 12 | 5 | 18% | -0.8 | 0 | 0 | 5.7 |
| 2018-12-02 | 2018 | 13 | LA | 16-30 | L | +10.5 | L | U | 10 | 7 | 35 | 0 | 23 | 38 | 30% | -3.9 | 0 | 0 | 10.5 |
| 2018-11-22 | 2018 | 12 | CHI | 16-23 | L | +3.0 | L | U | 7 | 6 | 28 | 0 | 22 | 11 | 19% | -1.4 | 1 | 2 | 9 |
| 2018-11-18 | 2018 | 11 | CAR | 20-19 | W | +4.0 | W | U | 9 | 6 | 52 | 0 | 32 | 30 | 26% | 0.3 | 0 | 0 | 11.2 |
| 2018-09-23 | 2018 | 3 | NYG | 22-27 | L | -6.5 | L | O | 1 | 1 | 10 | 0 | 10 | 0 | 3% | 2.1 | 0 | 0 | 2 |
| 2018-09-16 | 2018 | 2 | @TEN | 17-20 | L | -3.5 | L | U | 3 | 3 | 45 | 0 | 34 | 11 | 10% | 2.3 | 0 | 0 | 7.5 |
| 2018-09-09 | 2018 | 1 | @NE | 20-27 | L | +6.0 | L | U | 8 | 4 | 37 | 1 | 71 | 13 | 24% | 2.3 | 0 | 0 | 13.7 |
| 2017-12-03 | 2017 | 13 | @TEN | 13-24 | L | +7.0 | L | U | 2 | 1 | 7 | 0 | -2 | 11 | 4% | -1.6 | 0 | 0 | 1.7 |
| 2017-11-27 | 2017 | 12 | @BAL | 16-23 | L | +7.5 | W | U | 8 | 3 | 29 | 0 | 46 | 19 | 22% | -6.8 | 0 | 0 | 5.9 |
| 2017-11-19 | 2017 | 11 | ARI | 31-21 | W | -2.5 | W | O | 7 | 6 | 63 | 0 | 41 | 28 | 22% | 4.3 | 1 | 5 | 12.8 |
| 2017-11-12 | 2017 | 10 | @LA | 7-33 | L | +12.0 | L | U | 9 | 4 | 41 | 1 | 91 | 22 | 26% | -0.8 | 0 | 0 | 14.1 |
| 2017-11-05 | 2017 | 9 | IND | 14-20 | L | -6.0 | L | U | 8 | 3 | 22 | 0 | 85 | 10 | 18% | -3.3 | 0 | 0 | 5.2 |
| 2017-10-29 | 2017 | 8 | @SEA | 38-41 | L | +6.0 | W | O | 4 | 1 | 13 | 0 | 43 | 8 | 13% | 0.1 | 0 | 0 | 2.3 |
| 2017-10-15 | 2017 | 6 | CLE | 33-17 | W | -7.5 | W | O | 3 | 2 | 22 | 0 | 15 | 13 | 10% | 1.7 | 0 | 0 | 4.2 |
| 2017-10-08 | 2017 | 5 | KC | 34-42 | L | +2.0 | L | O | 3 | 2 | 30 | 0 | 37 | 13 | 10% | 0.4 | 0 | 0 | 5 |
| 2017-10-01 | 2017 | 4 | TEN | 57-14 | W | +2.5 | W | O | 4 | 3 | 44 | 0 | 61 | 4 | 12% | 1.8 | 1 | 13 | 8.7 |
| 2017-09-24 | 2017 | 3 | @NE | 33-36 | L | +13.5 | W | O | 7 | 4 | 59 | 1 | 139 | 8 | 21% | 4.9 | 1 | -1 | 15.8 |
| 2017-09-10 | 2017 | 1 | JAX | 7-29 | L | -5.5 | L | U | 2 | 0 | 0 | 0 | 6 | 0 | 6% | -1.2 | 0 | 0 | 0 |